Background and Setup
In this notebook I focus on explaining Poisson processes and conjugacy applied to my Twitter activity.
To get started, I followed directions from three main sources that walked through the twitter and python-twitter libraries, and described how to apply for Twitter API access and use the keys;
python-twitter: Blogpost heretweepy: Blogpost here and docs here- Additional information on obtaining API keys and authenticating Twitter connections in a blogpost here
I include my code to import the required libraries and set up API access keys, though the data used here were pulled and saved before writing the notebook. The main focus is on understanding Poisson processes and adaptive modeling of such processes using conjucacy.
library(reticulate)## Warning: package 'reticulate' was built under R version 3.5.2# Setup
# for working with timestamps
import pandas as pd
from pandas.plotting import register_matplotlib_converters
register_matplotlib_converters()
# for basic math
import numpy as np
# for plotting
import matplotlib.pyplot as plt
import seaborn as sns
# for working with distributions
from scipy.stats import expon,gamma,poisson,nbinom
# for general web data pulling
import requests
# for pulling tweets from Twitter API
import twitter
# keys for twitter API
# (removed for this public document)
api = twitter.Api(consumer_key='',
consumer_secret='',
access_token_key='',
access_token_secret='')
# for saving and loading Python objects like dicts
import pickle
def save_obj(obj, name):
with open(name + '.pkl', 'wb') as f:
pickle.dump(obj, f, pickle.HIGHEST_PROTOCOL)
def load_obj(name):
with open(name + '.pkl', 'rb') as f:
return pickle.load(f)Twitter Data
Pulling Data from Twitter’s API
First I pulled data using the code below. For this code to work, your API keys will need to be specified in the setup above. To conceil my keys, I ran the commented code below earlier and saved the timeline object. The uncommented code loads my timeline and looks at the first element. The timeline is represented as a list of Status objects like the one output by the code below.
# # Twitter handel to pull data from
# handle = '@macstrelioff'
#
# # get timeline
# timeline=api.GetUserTimeline(screen_name = handle,
#                     count=200, # 200 is maximum
#                     include_rts=True,
#                     trim_user=True,
#                     exclude_replies=False)
#
# # save timeline object
# save_obj(timeline,'timeline_macstrelioff_20190406')

# load timeline object
timeline=load_obj('timeline_macstrelioff_20190406')
timeline[0] # most recent tweet status object
>>> Status(ID=1113860296458756097, ScreenName=None, Created=Thu Apr 04 17:46:03 +0000 2019, Text="@vboykis df.dropna(how='brute force') https://t.co/QOULUc5a0u")Working with Twitter Status objects
I cover three ways to work with Status objects. 1. display the Status as a tweet! 2. Convert the Status to a dictionary and access values from keys 3. Access values directly as attributes of the Status
Embed a Status
First, many the Status attributes (created_at, favorite_count, text, …) can be cleanly displayed as a tweet embedded in a notebook. Below I create function that takes a username and tweet ID then, using Twitter’s embedding API, displayes the tweet as it would be seen on Twitter. (Note: this will only work properly if the Python kernel is trusted)
# for displaying tweets based on username and tweet_id
class disp_tweet(object):
    def __init__(self, user_name, tweet_id):
        # see: https://dev.twitter.com/web/embedded-tweets
        api = 'https://publish.twitter.com/oembed?url=https://twitter.com/'+ \
               user_name + '/status/' + tweet_id
        response  = requests.get(api)
        self.text = response.json()["html"]

    def _repr_html_(self):
return self.textdisp_tweet(user_name='macstrelioff',tweet_id='981338927419109376')>>> <__main__.disp_tweet object at 0x1a26d06710>If run from a Jupyter notebook, this should embed a tweet as below;
My desk is covered in random papers. It is the support of a stationery distribution.
— mac strelioff (@macstrelioff) April 4, 2018
Convert a Status to a dict
Status objects have a bound method, .AsDict(), that will convert them to a Python dictionary. This way the structure of the information is easily seen. In the code below, I convert the first status to a dictionary and output it contents.
print(timeline[0].AsDict())>>> {'created_at': 'Thu Apr 04 17:46:03 +0000 2019', 'favorite_count': 20, 'hashtags': [], 'id': 1113860296458756097, 'id_str': '1113860296458756097', 'in_reply_to_screen_name': 'vboykis', 'in_reply_to_status_id': 1113822568211996672, 'in_reply_to_user_id': 19304217, 'lang': 'da', 'media': [{'display_url': 'pic.twitter.com/QOULUc5a0u', 'expanded_url': 'https://twitter.com/macstrelioff/status/1113860296458756097/photo/1', 'id': 1113860285566046210, 'media_url': 'http://pbs.twimg.com/tweet_video_thumb/D3U6BzqUUAIwYEC.jpg', 'media_url_https': 'https://pbs.twimg.com/tweet_video_thumb/D3U6BzqUUAIwYEC.jpg', 'sizes': {'thumb': {'w': 150, 'h': 150, 'resize': 'crop'}, 'large': {'w': 250, 'h': 198, 'resize': 'fit'}, 'medium': {'w': 250, 'h': 198, 'resize': 'fit'}, 'small': {'w': 250, 'h': 198, 'resize': 'fit'}}, 'type': 'animated_gif', 'url': 'https://t.co/QOULUc5a0u', 'video_info': {'aspect_ratio': [125, 99], 'variants': [{'bitrate': 0, 'content_type': 'video/mp4', 'url': 'https://video.twimg.com/tweet_video/D3U6BzqUUAIwYEC.mp4'}]}}], 'retweet_count': 2, 'source': '<a href="http://twitter.com/download/android" rel="nofollow">Twitter for Android</a>', 'text': "@vboykis df.dropna(how='brute force') https://t.co/QOULUc5a0u", 'urls': [], 'user': {'id': 70255183, 'id_str': '70255183'}, 'user_mentions': [{'id': 19304217, 'id_str': '19304217', 'name': 'Vicki Boykis', 'screen_name': 'vboykis'}]}{'created_at': 'Thu Apr 04 17:46:03 +0000 2019',
'favorite_count': 20,
'hashtags': [],
'id': 1113860296458756097,
'id_str': '1113860296458756097',
'in_reply_to_screen_name': 'vboykis',
'in_reply_to_status_id': 1113822568211996672,
'in_reply_to_user_id': 19304217,
'lang': 'da',
'media': [{'display_url': 'pic.twitter.com/QOULUc5a0u',
'expanded_url': 'https://twitter.com/macstrelioff/status/1113860296458756097/photo/1',
'id': 1113860285566046210,
'media_url': 'http://pbs.twimg.com/tweet_video_thumb/D3U6BzqUUAIwYEC.jpg',
'media_url_https': 'https://pbs.twimg.com/tweet_video_thumb/D3U6BzqUUAIwYEC.jpg',
'sizes': {'thumb': {'w': 150, 'h': 150, 'resize': 'crop'},
'large': {'w': 250, 'h': 198, 'resize': 'fit'},
'medium': {'w': 250, 'h': 198, 'resize': 'fit'},
'small': {'w': 250, 'h': 198, 'resize': 'fit'}},
'type': 'animated_gif',
'url': 'https://t.co/QOULUc5a0u',
'video_info': {'aspect_ratio': [125, 99],
'variants': [{'bitrate': 0,
'content_type': 'video/mp4',
'url': 'https://video.twimg.com/tweet_video/D3U6BzqUUAIwYEC.mp4'}]}}],
'retweet_count': 2,
'source': '<a href="http://twitter.com/download/android" rel="nofollow">Twitter for Android</a>',
'text': "@vboykis df.dropna(how='brute force') https://t.co/QOULUc5a0u",
'urls': [],
'user': {'id': 70255183, 'id_str': '70255183'},
'user_mentions': [{'id': 19304217,
'id_str': '19304217',
'name': 'Vicki Boykis',
'screen_name': 'vboykis'}]}Access Status Attributes (How I accessed the data used below)
Since I’m interested in modeling expected number of tweets in a week, the most relevant attribute is the timestamps in the created_at attribute. These attributes can be accessed directly from the Status object. Below I make a list of the times at which each tweet was created and check the first element of that list;
# get list of time stamps
times = [pd.Timestamp(tweet.created_at) for tweet in timeline]
times.reverse() # sort s.t. times[0] is lowest, times[-1] is highest
times[0]
>>> Timestamp('2018-11-01 05:56:58+0000', tz='tzutc()')This creates a list of timestamps. By default, times from the twitter API are localized to the UTC timezone. Below I convert these to my local time in California;
times = [time.tz_convert("America/Los_Angeles") for time in times]
times[0]
>>> Timestamp('2018-10-31 22:56:58-0700', tz='America/Los_Angeles')Now we have a list of timestamps in local time! To get a sense of the duration over which this data spans, below I compute the time difference between the frist and last timestamp;
times[-1]-times[0]>>> Timedelta('154 days 11:49:05')Woah, almost 155 days of my twitter activity!
Poisson Process
A Poisson process is a common framework for modeling events that occurr in time or space. In this context, tweets are being created over time and we are interested in modeling the rate at which tweets are created in order to predict how many tweets will be created in a week.
Assumptions
- No more than one event can occur at a single point in time.
- This can be violated when a user publishes a thread of multiple tweets at once. This can be fixed by recoding threads as a single status.
- Independence: The interval lengths for each event are not influenced by any other event.
- This can be violated if, instead of using Twitter’s thread option, a user ends a tweet with “…” to indicate that they will soon create another tweet. In this case, there are some tweets that imply a shorter interval before the next tweet.
- Homogeneity: The distribution of intervals is the same throughout the entire process.
- I probe this assumption in depth below, and it almost certainly violated.
- There are methods for modeling inhomogeneous Poisson processes, but I ignore those here.
Specification and Properties
In this context tweet events are occurring across time. I index tweets with \(i\in\{1,...,N\}\), where \(N\) is the total number of tweets observed. Each tweet is created at a time, \(t_i\), and the next tweet is observed after an interval \(s_{i}\). That is, if tweet \(i\) is created at time \(t_{i-1}\) then tweet \(i+1\) is created at time \(t_{i}=t_{i-1}+s_{i}\). The interval between each tweet is \(s_i = t_{i}-t_{i-1} = (t_{i-1}+s_i)-t_{i-1}\). The assumptions of a Poisson process permit the following distributions for three interesting features of this scenario.
- The distribution of time between events, \(s_i\), is exponential; \(s_i\sim Expo(\lambda) \Rightarrow p(s_i|\lambda) = \lambda e^{-\lambda s_i}\)
- Here \(\lambda\) is a parameter that describes the tweet rate.
- Given an interval of length \(s\), the distribution of the count of events in that interval, \(c|s\), is Poisson; \(c|s\sim Poisson(\lambda s) \Rightarrow p(c|s,\lambda) = \frac{(\lambda s)^{c}e^{-\lambda s}}{c!}\)
- The count of events, \(c\), in a fixed interval depends both on the rate of the events, \(\lambda\), and the duration of the interval, \(s\).
- The distribution of the total interval required for \(c\) events, \(s|c\), is gamma; \(s|c \sim Gamma(c,\lambda) \Rightarrow p(s|c,\lambda) = \frac{\lambda^c}{\Gamma(c)}(s)^{c-1}e^{-\lambda s}\)
- The interval, \(s\), required for a fixed number of events depends on both the rate of the events, \(\lambda\), and the number of events, \(c\).
More information on these three kinds of distributions, and ways to implement them in Python, can be found in the scipy documentation on statistical functions. General information on each of these distributions can be found on the Wikipedia page for the exponential, Poisson, or gamma distribution. A key difference between the standard uses of these distributions and their roles in a Poisson process is that the rate parameter \(\lambda\) is also scaled by the duration of an interval \(s\) when constructing a distribution for the count of events in interval \(s\) (2, above) or the duration of the interval required for \(c\) events (3, above).
Checking the Homogeneity Assumption
The homogeneity assumption strictly requires that tweet rates are constant across time. This would generate data that are uniform across meaningful intervals such as time in a week or time in a day. To check homogeneity, below I convert the timestamps into the hour within a week, minute within a day, and minute within an hour, and plot tweet counts across these representations of time.
# convert to hours in a week
hour_of_week     = [t.weekday()*24+t.hour+t.minute/60 for t in times]
minute_of_day    = [t.hour*60+t.minute+t.second/60 for t in times]
minute_of_hour   = [t.minute+t.second/60 for t in times]
plt.figure(figsize=(10,4));
plt.hist(hour_of_week,bins=80);
plt.title("My Tweet Counts By Hour Of Week");
plt.ylabel("Count");
plt.xlabel("Hour In Week");
The histogram above indicates that there might be some hours of the week that have a higher rate than others. For example, I don’t seem to tweet much early on Sunday (hours 0-5), but I do seem to tweet a lot during the day on Sunday (around hours 6-20). Below I use rug plots, which represent a tweet event with a vertical line near the x-axis, and an imposed kernel density estimate, which is a continuous version of a histogram. I remake this plot in terms of hours within a week, minutes within a day, and minutes within an hour. If the tweet rate (\(\lambda\)) were homogeneous, then the kernel density estimate would be approximately flat.
def rug_plot_and_density(dat,bw,xlab,xlim):
    # rug plot + density
    plt.figure(figsize=(10,4))
    sns.distplot(dat, hist = False, kde = True, rug = True,
                 color = 'darkblue',
                 kde_kws={'linewidth': 3,"bw":bw},
                 rug_kws={'color': 'black'})
    # formatting
    plt.title('Tweet Density By '+xlab)
    plt.xlabel(xlab)
    plt.ylabel('Kernel Density')
    plt.xlim(xlim);
    plt.show()
# data and plot formatting arguments
dats = (hour_of_week,minute_of_day,minute_of_hour)
xlabs=('Hour of Week','Minute of Day','Minute of Hour')
xlims=([0,24*7],[0,24*60],[0,60]);
bws = (4,40,4)
# make plots
for dat,xlab,xlim,bw in zip(dats,xlabs,xlims,bws):
rug_plot_and_density(dat=dat,bw=bw,xlab=xlab,xlim=xlim)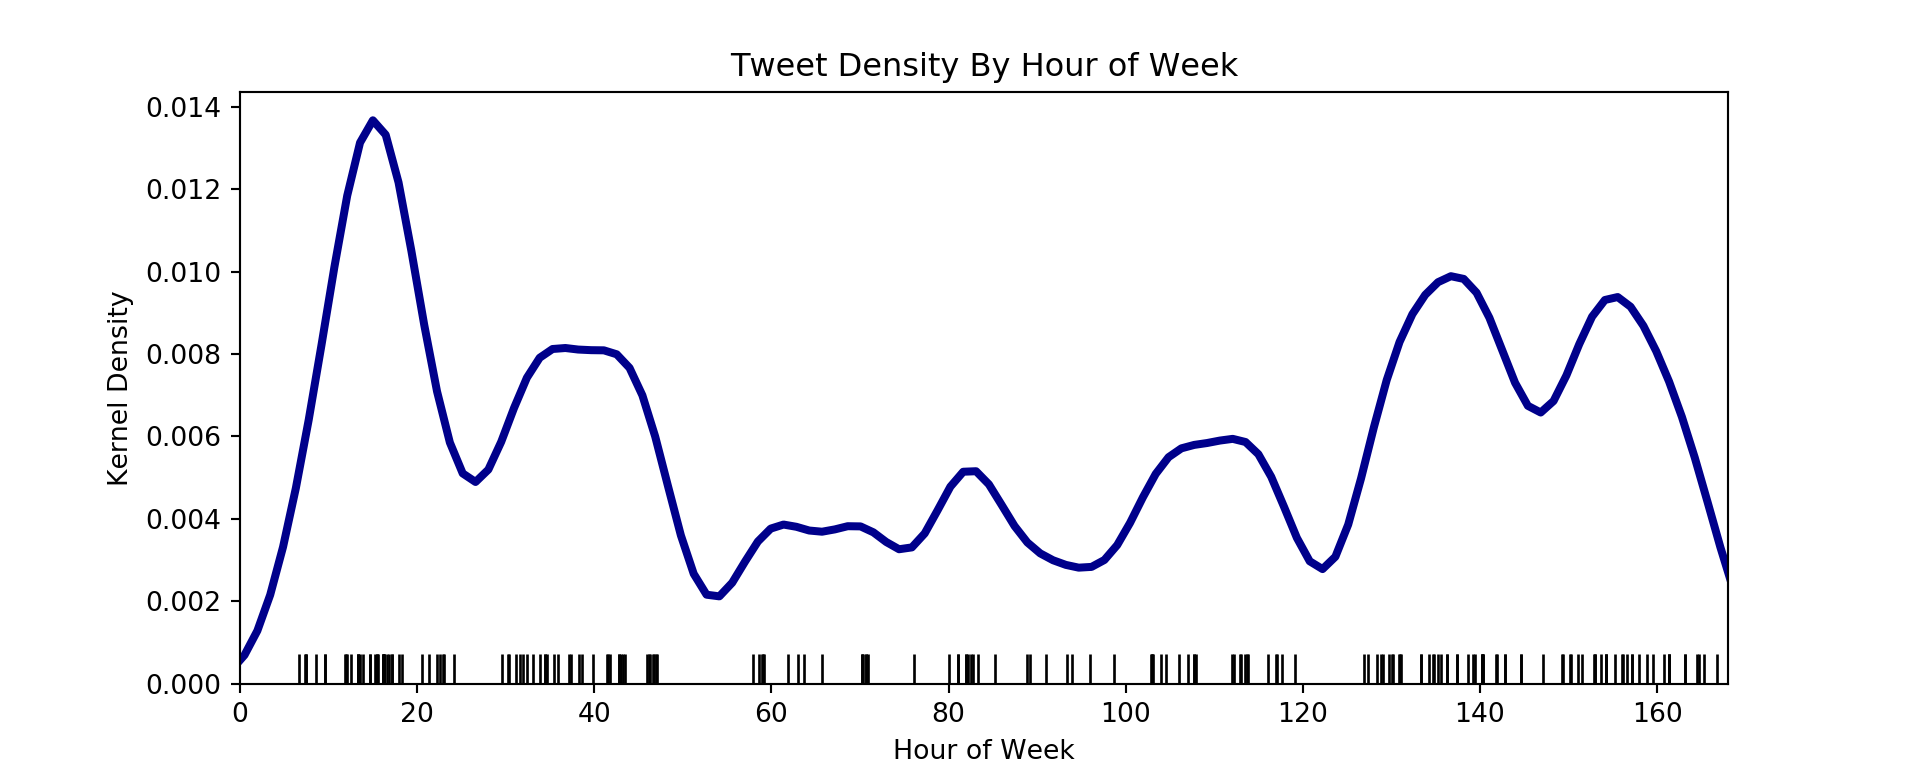


Are very sensitive to the choice of the bandwidth parameter that determines the window over which to aggregate events (similar to bin size when using a histogram). I’m using these plots to demonstrate possible violations of homogeneity that I would follow up on in a real analysis, but will not follow up on here.
From the top plot, there seems to be two patterns. First, a series of peaks and troughs that roughly correspond to daytime and night-time hours. I probably tweet with a higher frequency when I am awake, rather than asleep – meaning that \(\lambda\) may depend on time within a day. Second, a generally lower kernel density estimate during the middle than the edges. I may tweet more during the weekends (edge hours) than week days (middle hours).
From the middle plot that displays tweet frequencies by minutes within a day, there again seem to be two trends. First, I rarely tweet before minute 400 (around 6:40AM). Second, I have peaks around minute 600 (10:00AM), 1000 (4:40PM), and 1350 (10:00PM). This might be related to the times that I take a break from working. I generally take a break around 5:00PM, and usually take another break before bed around 9:00-10:00PM.
The bottom plot displays tweet frequencies by minutes within an hour. This seems more flat overall longer periods of time, but I may strangely tend to tweet more during the first half of hours.
Overall, there are many reasons that the homogeneity assumption may be violated. For cases like this, the tweet rate \(\lambda\) can be modeled as a function of time. However, to keep this example simple, I’ll ignore possible violations and proceede as if \(\lambda\) were a constant with respect to time.
Checking the exponential distribution of intervals
Let’s the distribution of the time between tweets, \(s_i\). If the assumptions of the Poisson process were satisfied, then the intervals between tweets would follow an exponential distribution. Below I compute the number of seconds between tweets and display each value as a black dash on the x-axis. I overlay a histogram, a kernel density, and a exponential density based on the observed mean interval.
# compute intervals between tweets
ss = [times[i]-times[i-1] for i in range(1,len(times))];
# convert from Timedelta to total time in seconds
ss = [si.total_seconds() for si in ss]

# histogram and density plot
plt.figure(figsize=(10,4))
sns.distplot(ss, hist = True, kde = True, rug = True,
             color = 'darkblue', bins=100,
             hist_kws={'color':[0,.7,.5,.5],'label':'Histogram'},
             kde_kws={'linewidth': 3,"bw":60*60,'label':'Kernel Density'},
             rug_kws={'color': 'black'})
plt.xlim([0,680000]);
plt.title('Distribution of intervals between tweets')
plt.xlabel('Seconds')
plt.ylabel('Frequency')
# overlay an exponential density
tmp_rate=np.mean(ss)
tmpx = np.linspace(0,680000,680000*5)
tmpy = expon.pdf(tmpx,scale=tmp_rate)
plt.plot(tmpx,tmpy,color=[.7,0,0,1],linewidth=3,label='Exponential Density');
# add legend
plt.legend();
Based on the relative heights of the kernel density and the exponential density, there seem to be more short intervals, fewer moderate length intervals, and more long intervals relative to the exponential distribution. The mean and standard deviation of an exponential distribution should be the same value. Below I check the standard deviation and mean of the observed intervals.
# check standard deviation
np.std(ss),np.mean(ss),np.std(ss)/np.mean(ss)
>>> (90150.9122414953, 67076.1055276382, 1.3440093388300445)The observed standard deviation is about 1.34 times larger (variance is about 1.80 times larger) than it would be if the data were exponentially distributed with the observed mean. While this could be accounted for with an overdispersion parameter, I will ignore this issue here for the sake of having a simple and fast online model.
Model of Tweet Fequency Using Conjugacy
First, I’ll assume (despite the overdispersion) that the intervals between tweets follow an exponential distribution;
\[ \begin{aligned} s_i|\lambda &\sim Expo(\lambda) \\ \Rightarrow p(s_i|\lambda) &= \lambda e^{-s_i \lambda} \end{aligned} \]
To account for uncertainty in \(\lambda\), I’ll use a Gamma distribution with shape \(\alpha\) and rate \(\beta\);
\[ \begin{aligned} \lambda &\sim Gamma(\alpha,\beta) \\ \Rightarrow p(\lambda|\alpha,\beta) &= \frac{\beta^\alpha}{\Gamma(\alpha)} \lambda^{\alpha-1}e^{-\lambda \beta} \end{aligned} \]
The choice of a Gamma distribution allows for fast updates using conjugacy between the prior beliefs about \(\lambda\) based on data observed up to time \(t\) and the exponential likelihood for the interval observed at time \(t\);
\[ \begin{aligned} \lambda | s_t &\sim Gamma(\alpha_t,\beta_t) \\ p(s_{t+1}|\lambda) &= \lambda e^{-s_{t+1} \lambda} \\ p(\lambda|\alpha_t,\beta_t,s_{t+1}) &\propto p(s_{t+1}|\lambda) p(\lambda|\alpha_t,\beta_t) \\ &= \lambda e^{-s_{t+1} \lambda} \frac{\beta_t^{\alpha_t}}{\Gamma(\alpha_t)} \lambda^{\alpha_t-1}e^{-\lambda \beta_t} \\ &= \lambda^{\alpha_t} e^{-\lambda(s_{t+1}+\beta_t)} \\ \Rightarrow \lambda | s_{t+1} &\sim Gamma(\alpha_t+1,\beta_t+s_{t+1}) \end{aligned} \]
This implies the following update rules for computing the parameters of the posterior over \(\lambda\);
\[ \begin{aligned} \alpha_{t+1} &\leftarrow \alpha_t +1 \\ \beta_{t+1} &\leftarrow \beta_t + s_{t+1} \\ \end{aligned} \]
To answer the question of how many tweets might be observed in a period of time, I’ll assume that the count of tweets \(c\) is Poisson distributed with rate \(\lambda\). Then the number of tweets expected in an interval of length \(s\) would be;
\[ \begin{aligned} \theta &= s\lambda \\ c|\theta &\sim Poisson(\theta) \\ \Rightarrow p(c|\theta) &= \frac{\theta^c e^{-\theta}}{c!} \end{aligned} \]
This means that, rather than \(\lambda\), we are actually interested in the distribution of \(\theta=s\lambda\). I derive this below using a change of vairables;
\[ \begin{aligned} \theta = s\lambda &\Rightarrow \lambda = \frac{\theta}{s} = \theta s^{-1} \\ p_\theta(\theta | \lambda,s) &= p_\lambda\left(\theta s^{-1} | s,\alpha,\beta\right) \left| \frac{d \lambda}{d \theta}\right|\\ &= \frac{\beta^\alpha}{\Gamma(\alpha)} \left(\frac{\theta}{s}\right)^{\alpha-1}e^{-\frac{\theta}{s}\beta} \left|s^{-1}\right| \\ &= \frac{\beta^\alpha}{\Gamma(\alpha)} \theta^{(\alpha-1)}s^{-({\alpha-1})-1}e^{-\frac{\theta}{s}\beta} \\ \Rightarrow p(\theta|s,\alpha,\beta)&= \frac{\left(\frac{\beta}{s}\right)^\alpha}{\Gamma(\alpha)} \theta^{(\alpha-1)}e^{-\theta\frac{\beta}{s}}\\ \end{aligned} \]
Now we can find the distribution of \(c\) that accounts for uncertainty in \(\theta\) through the prior on \(\lambda\);
\[ \begin{aligned} p(c|s,\alpha,\beta) &= \int_\theta p(c|\theta)p(\theta|s,\alpha,\beta)d\theta \\ &=\int_\theta \frac{\theta^c e^{-\theta}}{c!} \frac{\left(\frac{\beta}{s}\right)^\alpha}{\Gamma(\alpha)} \theta^{(\alpha-1)}e^{-\theta\frac{\beta}{s}} d\theta \\ &= \frac{\left(\frac{\beta}{s}\right)^\alpha}{c!\Gamma(\alpha)} \int_\theta \theta^c e^{-\theta} \theta^{(\alpha-1)}e^{-\theta\frac{\beta}{s}} d\theta \\ &=\frac{\left(\frac{\beta}{s}\right)^\alpha}{c!\Gamma(\alpha)} \int_\theta \theta^{c+\alpha-1} e^{-\theta\left(\frac{\beta+s}{s}\right)} d\theta \\ &=\frac{\left(\frac{\beta}{s}\right)^\alpha}{c!\Gamma(\alpha)} \frac{\Gamma(c+\alpha)}{\left(\frac{\beta+s}{s}\right)^{c+\alpha}} \\ &=\frac{\Gamma(c+\alpha)}{c!\Gamma(\alpha)} \beta^\alpha s^{-\alpha} s^{c+\alpha} (\beta+s)^{-(c+\alpha)} \\ &=\frac{\Gamma(c+\alpha)}{\Gamma(c+1)\Gamma(\alpha)} \left(\frac{s}{\beta+s}\right)^c \left(\frac{\beta}{\beta+s}\right)^\alpha \\ \end{aligned} \]
Since a Poisson Process assumes that no more than one event can occur in an interval, intervals can be treated as discrete Bernoulli trials in which an event either occurs or does not occur. In this discrete setting, the distribution of the count of intervals with an event \(k\) for a given number of intervals without the event \(r\) and a probability of the event in each interval \(p\) will follow a negative binomial distribution;
\[ \begin{aligned} k &\sim NegBino(r,p) \\ \Rightarrow p(k|r,p) &= \frac{(k+r-1)!}{r! (k-1)!}p^{k}(1-p)^{r} \\ &= \frac{\Gamma(k+r)}{\Gamma(r+1) \Gamma(k)}p^{k}(1-p)^{r} \\ \end{aligned} \]
Combining the two results above, we see that the count \(c\) in an interval \(s\) will follow a negative binomial distribution such that \(\alpha\) fixes the number of intervals in which no event occurs, and \(\frac{s}{\beta+s}\) captures the probability of an event in any unit length interval;
\[ \begin{aligned} c &\sim NegBino\left(\alpha,\frac{s}{\beta+s}\right) \\ \Rightarrow p(c|s,\alpha,\beta) &= \frac{\Gamma(c+\alpha)}{\Gamma(c+1)\Gamma(\alpha)} \left(\frac{s}{\beta+s}\right)^c \left(\frac{\beta}{\beta+s}\right)^\alpha \\ \end{aligned} \]
In summary, the key components of this model are the exponential likelihood and gamma priors which allow for the fast and simple updating rules to compute the posterior over \(\lambda\), and the negative binomial predictive distribution which accounts for the uncertainty in \(\lambda\). So the applicable information from above is;
\[ \begin{aligned} \lambda &\sim Gamma(\alpha_t,\beta_t) \\ s_{t+1} &\sim Expo(\lambda) \\ \alpha_{t+1} &\leftarrow \alpha_t + 1 \\ \beta_{t+1} &\leftarrow \beta_t + s_{t+1} \\ c|s,\alpha,\beta &\sim NegBino\left(\alpha,\frac{s}{\beta+s}\right) \\ \end{aligned} \]
Here I investigate posterior predictive intervals for tweets over a period of time \(s\) while using different components of this model. In the code below, I compute all values of \(\alpha\) and \(\beta\) based on the update rules derived above from conjugacy.
# initialize alpha,beta as 0
alpha,beta = 0,0
alphas,betas = list(),list()
# for each observed interval in ss,
for si in ss:
    si = si/(60*60*24) # si s/1 * 1/60 m/s * 1/60 h/m * 1/24 d/h convert to days
    alpha+=1 # increment alpha by 1
    beta+=si # increment beta by the interval length
    # save parameters for analysis
    alphas.append(alpha)
    betas.append(beta)
The code above converts intervals from seconds to days and comptutes \(\alpha\) and \(\beta\) for all intervals in my dataset. This gives the parameters for posterior beliefs over \(\lambda\) as each tweet is observed. Below I check the final parameters and some statistics from the last posterior.
a,b,mode,median,mean=(alpha,beta,(alpha-1)/beta,gamma.ppf(.5,a=alpha,scale=1/beta),alpha/beta)
print(  'alpha : '+str(a)+
      '\nbeta  : '+str(b)+
      '\nmode  : '+str(mode)+
      '\nmedian: '+str(median)+
      '\nmean  : '+str(mean))
>>> alpha : 199
>>> beta : 154.49241898148153
>>> mode : 1.2816162845099446
>>> median: 1.2859321345366828
>>> mean : 1.2880890940276715The value of \(\alpha\) correctly indicates 199 observed intervals, and the \(\beta\) of 154.59 also correctly reflects the time difference in days that was computed in the first section. Lastly the ordinal relationship of the mode, median, and mean is consistent with that of a gamma distribution.
Inference On Tweet Rate \(\lambda\) Over Time
In the code below, I compute the maximum a posteriori (MAP) estimate, or posterior mode, across time. I plot this across time with the 97.5\(^{th}\) and 2.5\(^{th}\) percentiles as a shaded region representing the 95% credible interval.
# get MAP lambda
lambda_map   = [(alpha-1)/beta for alpha,beta in zip(alphas,betas)]
# get CI upper and lower bounds
lambda_upper = [gamma.ppf(.975,a=alpha,scale=1/beta) for alpha,beta in zip(alphas,betas)]
lambda_lower = [gamma.ppf(.025,a=alpha,scale=1/beta) for alpha,beta in zip(alphas,betas)]
# plot over time
plt.figure(figsize=(10,4))
plt.plot(times[1:],lambda_map,color=[0,0,1],label='MAP');
plt.fill_between(times[1:], lambda_lower, lambda_upper,color=[0,0,1,.1],label='95% CI')
#sns.distplot(times[1:], hist = False, kde = False, rug = True,
#             color = 'darkblue',
#             rug_kws={'color': 'black'});
plt.ylabel('Posterior on Lambda (tweets/day)')
plt.xlabel('Time')
plt.title('Summary of the posterior over $\lambda$ across time')
plt.legend();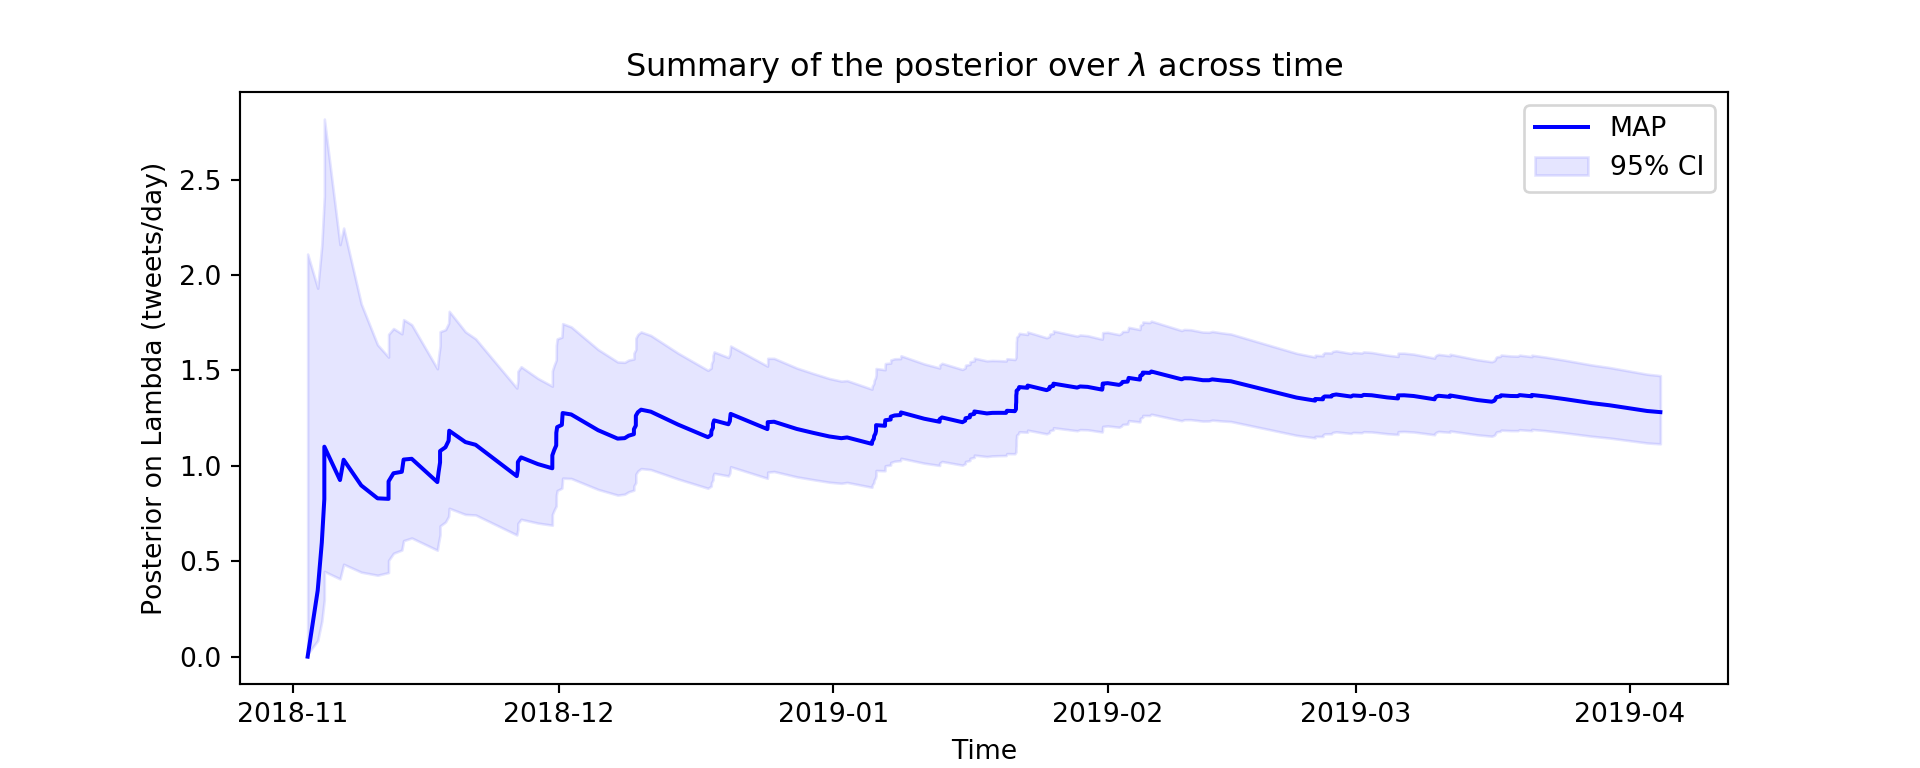
The posterior seems to tighten dramatically around the mode during the first month, and the mode seems to stabalize after about that much time. However, this method seems slow to adjust to the slower rate of tweets in 2019. One way to address this might be to add weights to the parameter updates such that \(\alpha\) and \(\beta\) are more sensitive to recent data than past data. These weights (or stepsize or learning rates) can be based on the surprisal, or likelihood, of a new tweet under the posterior. If the new interval was well anticipated, then little updating is needed, but if the new interval was very surprising or unlikely, then a sharpe change in \(\alpha\) and \(\beta\) might be warrented.
Predicting Number Of Tweets In Interval \(s\)
Now I’ll visually compare predictions for the count of tweets in a week based on estimates of \(\lambda\) after the first 20 tweets and using all 200 tweets, using two models;
- A Poisson using \(\theta=s\lambda_{MAP}\)
- The negative binomial derived in the model section above
First, an issue with the parameterization of the negative binomial has to be addressed. In my derivation, I ended with a negative binomial parameterized as;
\[ \begin{aligned} k&:\text{Number of successes} \\ r&:\text{Number of failures} \\ p&:\text{Probability of failure} \\ p(k|r,p) &= \frac{(k+r-1)!}{r! (k-1)!}p^{k}(1-p)^{r} \\ \end{aligned} \]
The Scipy.stats.nbinom function defines a negative binomial with;
\[ \begin{aligned} k&:\text{Number of failures} \\ n&:\text{Number of successes} \\ p&:\text{Probability of success} \\ p(k|n,p) &= \frac{(k+n-1)!}{(n-1)!k!} p^{n}(1-p)^{k} \end{aligned} \]
Recall in my derivation that the parameter corresponding to probability of failure was \(p=\frac{s}{\beta+s}\). The differences in parameterization can be accounted for by supplying the nbinom function with \(p=1-\frac{s}{\beta+s}=\frac{\beta}{\beta+s}\).
The code below plots predictive densities based on the two approaches above from estimates of \(\lambda\) based only on the first 20 observations.
# for the first 20 tweets
# parameters
cs = range(20)
s = 7
index = 19
theta = s*lambda_map[index]
plt.figure(figsize=(10,4))
# plot the Poisson density
plt.scatter(cs,poisson.pmf(cs,theta))
plt.plot(   cs,poisson.pmf(cs,theta),label='Poisson')
# plot the negative binomial density
plt.scatter(cs,nbinom.pmf(cs,n=alphas[index],p=betas[index]/(s+betas[index])))
plt.plot(   cs,nbinom.pmf(cs,n=alphas[index],p=betas[index]/(s+betas[index])),label='Negative Binomial');
# labels
plt.ylabel('Mass')
plt.xlabel('Count')
plt.title('Predictions for Tweet Counts in a Week, Using 20 Observations')
plt.legend();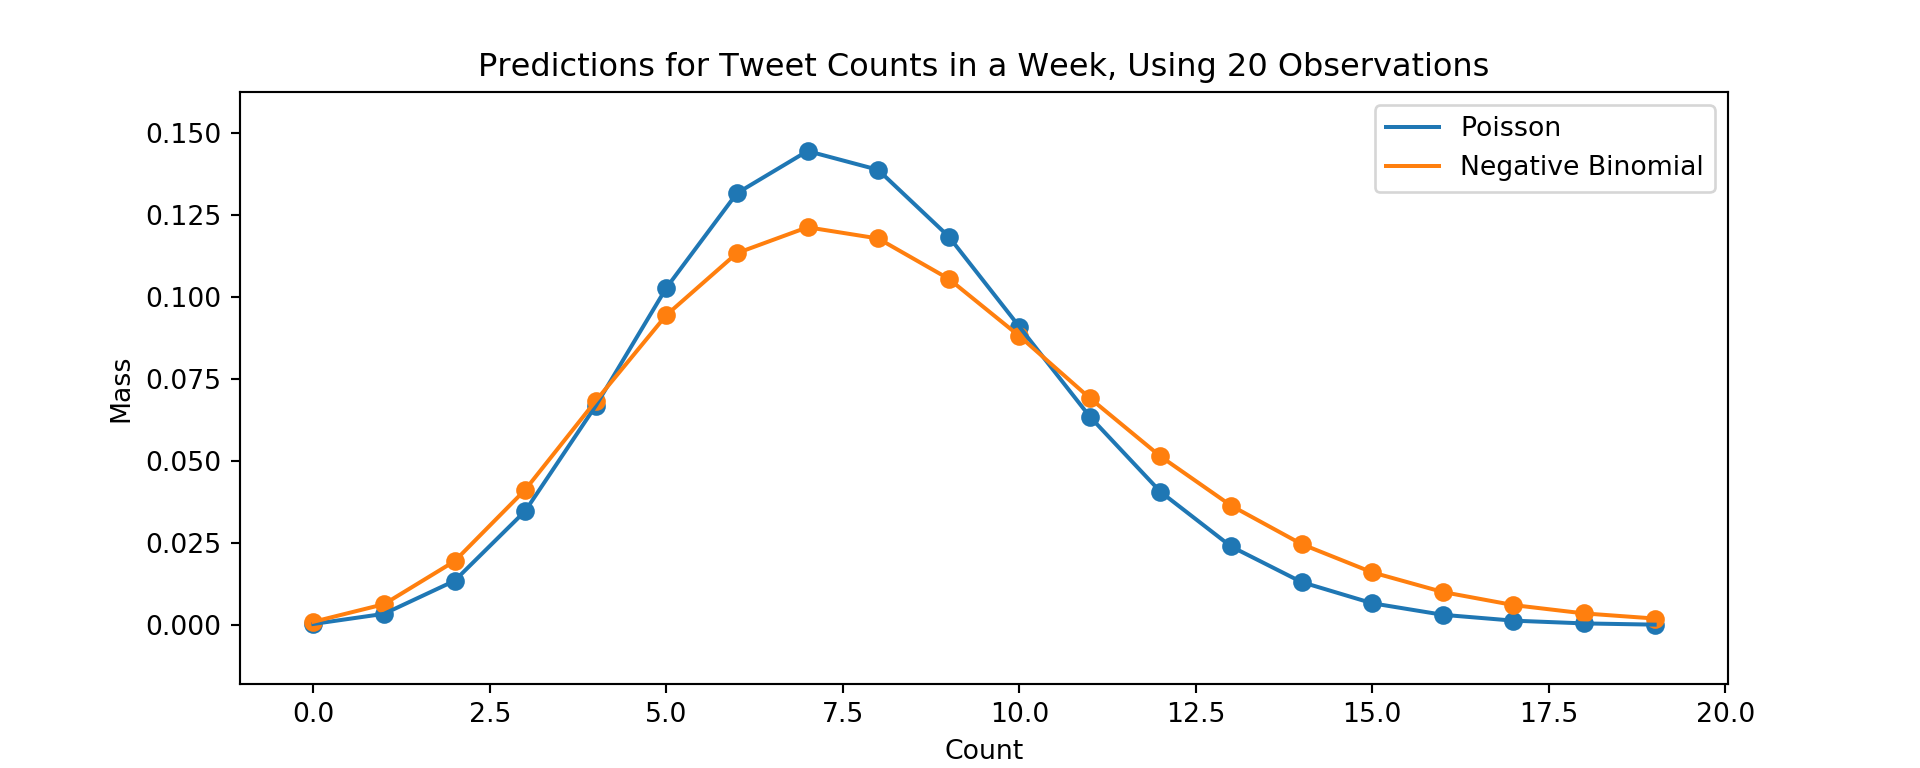
With a small amount of data, the uncertainty in the estimate of tweet rates carries through the negative binomial model, which gives more mass to a wider range of counts relative to the Poisson model that discards uncertainty when by \(\lambda_{MAP}\).
# Using all data
# parameters
index = 198
theta = s*lambda_map[index]
plt.figure(figsize=(10,4))
# plot the Poisson density
plt.scatter(cs,poisson.pmf(cs,theta))
plt.plot(   cs,poisson.pmf(cs,theta),label='Poisson')
# plot the negative binomial density
plt.scatter(cs,nbinom.pmf(cs,n=alphas[index],p=betas[index]/(s+betas[index])))
plt.plot(   cs,nbinom.pmf(cs,n=alphas[index],p=betas[index]/(s+betas[index])),label='Negative Binomial');
# labels
plt.ylabel('Mass')
plt.xlabel('Count')
plt.title('Predictions for Tweet Counts in a Week, Using All Data')
plt.legend();
With a larger amount of data and predicting the tweet count over a short interval (7 days), the predictive distribution from the negative binomial and Poisson models are nearly indistinguishable. Below I compare the predictions of these model for an interval of 1 year (365 days), again using all data.
# Using all data
# parameters
cs=range(350,600)
s = 365
index = 198
theta = s*lambda_map[index]
plt.figure(figsize=(10,4))
# plot the Poisson density
plt.scatter(cs,poisson.pmf(cs,theta))
plt.plot(   cs,poisson.pmf(cs,theta),label='Poisson')
# plot the negative binomial density
plt.scatter(cs,nbinom.pmf(cs,n=alphas[index],p=betas[index]/(s+betas[index])))
plt.plot(   cs,nbinom.pmf(cs,n=alphas[index],p=betas[index]/(s+betas[index])),label='Negative Binomial');
# labels
plt.ylabel('Mass')
plt.xlabel('Count')
plt.title('Predictions for Tweet Counts in a Year, Using All Data')
plt.legend();
When considering a longer period of time, The uncertainty in \(\lambda\) again carries through the negative binomial model, but is discarded in the Poisson model that uses \(\lambda_{MAP}\).
Summary
This was a beefy notebook!
First I showed how to pull tweets as Status objects from Twitter’s API. Given Status objects, I then showed how to embed them in a notebook, view them as a dictionary, and otherwise access their attributes to construct a list of tweet timestamps. I then described Poisson Processes as they may apply to modeling user tweet rates and tweet counts over periods of time. I used kernel densities to check assumptions of a Poisson Process and found possible violations of homogeneity, and of the result that intervals between tweets should follow an exponential distribution.
Punting these violations, I developed a model of tweet frequency using conjugacy between Gamma priors and Exponential likelihoods. To predict tweet counts over a period of time, I derived a negative binomial predictive distribution that accounted for uncertainty in a user’s tweet rate. I compared this distribution to a Poisson distribution that ignored uncertainty by taking only the maximum a posteriori estimate of a user’s tweet rate.
Overall the model that discards posterior uncertainty attributes less mass to fringe counts, especially when there is little data or when the interval over which counts are being predicted is long. Incorporating posterior uncertainty broadens the predictive distribution to reflect uncertainty in the underlying tweet rate. That uncertainty exists regardless of the modeling approach – excluding it from predictive distributions only leads to narrow, overconfident predictions. This general principle of propagating uncertainty through a statistical process is one strong advantage of the Bayeian modeling approach that I developed and applied here.